Measuring Blood Sugar as a Non-Diabetic
Insights from two weeks with a Continuous Glucose Monitor
I have always been curious about nutrition and metabolic health in general as I have been doing competitive sports since childhood. As an experiment, I decided to wear a Continuous Glucose Monitor (CGM) that lasts two weeks to measure my blood sugar. I am not diabetic and there’s no medical need for me to monitor my blood sugar, but I wanted to learn more about my own body and its response to food and lifestyle.
Here is the result of the experiment, including the glucose data and the insights I have gotten out of it.
TL;DR
- As a healthy, non-diabetic adult I wore a Continuous Glucose Monitor (CGM) to measure my blood sugar for two weeks
- The sensor was convenient to use and painless to apply, and was barely noticeable during the two weeks it was on my arm.
- In analyzing my blood sugar levels, I learned a lot about my body’s response to different foods and exercise; I could identify some foods that spike my glucose.
- Two weeks is too short to make detailed improvements to my nutrition in order to stabilise glucose levels — further monitor and experimentation will be needed.
The Device
I ordered the FreeStyle Libre 2 Sensor from Abbott which can be easily scanned with a NFC enabled smartphone (I used an Android mobile phone). The sensor allows you to record blood sugar data continuously without having to prick your finger every time as you would do with traditional methods. It can record your glucose levels for two weeks after which it expires and needs to be replaced.
The package comes with an applicator that is easy to position, and allows you to attach the sensor safely to your skin. I placed mine on the tricep of my right arm. A little prick is all you feel when the sensor gets applied. I was initially worried that it might fall off during exercise or fast movements, but the sensor stayed neatly on my arm for the whole two weeks and did not interfere with my daily activities at all.
A quick tap with my smartphone will load the last eight hours of glucose data in the app, with the latest 15 minutes at higher temporal resolution. The first two days I had issues with scanning the sensor: I often got an error that the data couldn’t be read. After that initial period however, the reading worked flawlessly. I assume it might be that the sensor needed time to “settle”. The companion app for the sensor will also warn you when the sensor is about to expire after two weeks so you can prepare to replace it. I only ordered one sensor so my experiment came to an end after two weeks when the device stopped working.
The Data
Abbott’s FreeStyle Libre Link app is meant for diabetics and alerts the users if they reach dangerously low or high glucose levels. For my experiment, I decided to export the data from the FreeStyle Libre Viewer app as a .csv file in order to do my own analysis in Python (jupyter notebook). If you are curious about the plots and data processing, I am happy to share the code with you if you reach out to me directly.

The key data the Libre2 sensor captures is blood glucose (mmol/L). The above chart displays my glucose level for one of my more extreme days: this day had a particularly high variance in blood sugar, with the spikes occurring after meals. In this graph, you can see the fluctuation is also significantly influenced by exercise (HITT at 16:00) — more on that later. Most of my days are relatively flat, compared to the above example; it is my goal to optimise my nutrition to maintain a stable level.
My Average Glucose Levels
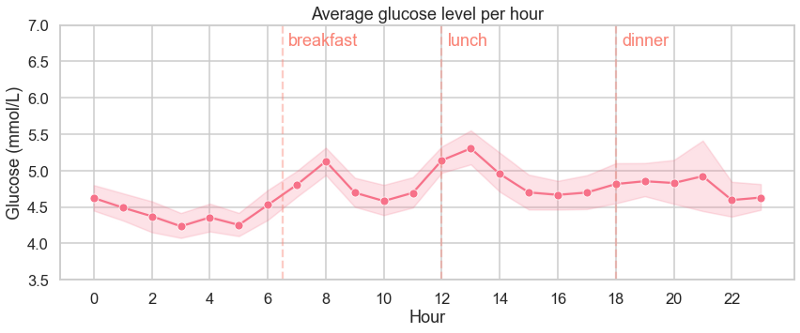
Hourly
Typical glucose levels for non-diabetics range between 4.0 to 5.9 mmol/L pre-meal and below 7.8 mmol/L 90 minutes after a meal (according to diabetes.co.uk).
Looking at my average stable levels and the individual spikes after eating, my glucose is in the healthy range (see chart below). This demonstrates overall good insulin sensitivity and my body’s ability to control glucose. My low fasting levels might be due to me generally avoiding processed foods and added sugars — although I do eat sweets occasionally, as well as regularly exercising, which is known to stabilize and lower blood glucose. In fact, the app recorded quite a few low sugar events, particularly at night when my body is fasted. At these times my glucose levels would fall to a baseline of <4 mmol/L during sleep.
Daily
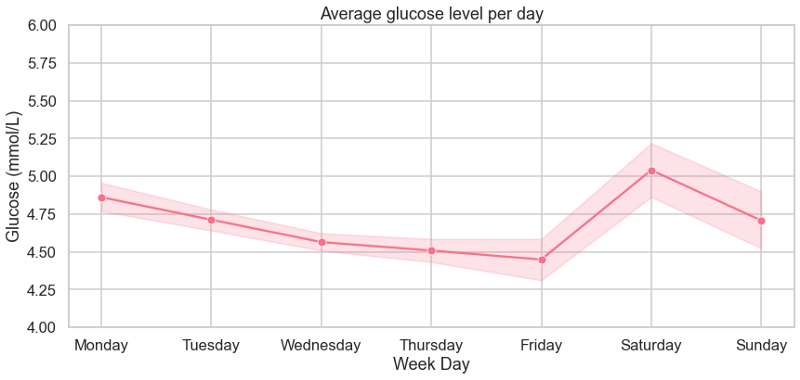
There is a strong weekly trend observed in the two weeks of measurement: my glucose tends to fall Monday to Friday but elevates on the weekend. This correlates with my food intake schedule — I generally eat more on weekends because of more social activities. I also consumed alcohol on both of the weekends during the experimentation window. Carbohydrate and sugar intakes were therefore higher on Friday, Saturday and Sunday, which is seen in my glucose levels and their variance, and dropped to relatively low levels hroughout the week.
Another factor of higher blood sugar levels and higher variance recorded on weekends could be my exercise routine. I exercise six times a week, with longer, often more intense sessions on Saturday and Sunday mornings. These morning workouts are sometimes done fasted — with no breakfast beforehand.
Analysing these days, I noticed large but fast spikes of glucose early during the fasted exercise window. This was surprising at first, but is in fact a normal behaviour. Reacting to the physical demand of exercising, my body makes glucose available to the muscles in order to fuel the movement at the onset. After about 30 minutes, the glucose begins to decline, causing a subsequent decline in insulin and rise in blood glucagon. This then leads to an increase in glucose output from the liver to maintain adequate glucose in the blood to fuel both the muscles and the brain.
Response to Specific Foods
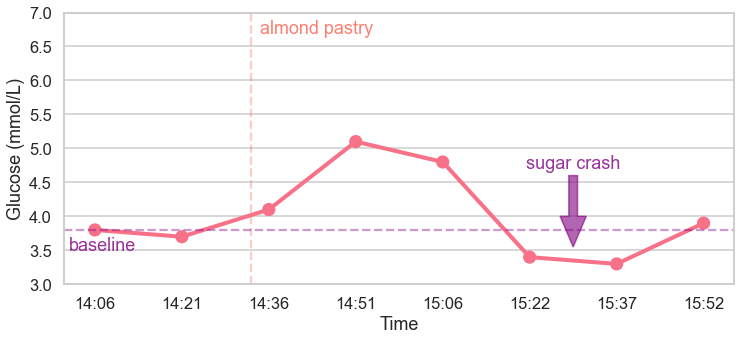
A) Sweet Pastry Now, let’s have a look at how specific foods affected my body and if there are any foods that spike my glucose strongly — and subsequently I should avoid. A great example is eating a piece of sweet pastry (Swedish almond bun) after lunch. You can see in the chart below how the glucose level rises very quickly after eating the sweet, noticeably faster (20 minutes to peak) than when taking in a larger meal. This quick rise is followed by a drop below the pre-snack sugar level of 3.7 mmol/L.
This is what we call a sugar crash (reactive hypoglycemia), and is usually very noticeable as post-meal fatigue and dizziness. Fortunately, this particular crash didn’t last long and my glucose raised back to baseline after another 30 minutes. The size of this dip after a meal has been related to the feeling of hunger in the hours after eating in a recent Nature study. The study found that the larger the dip the quicker you’ll feel hungry again and the more you will eat at your next meal. This links the spikes and dips of your glucose response to immediate energy intake and diet.
In the long term, high volumes of glucose spikes are associated with lower insulin resistance and the development of type two Diabetes (T2D). Furthermore, blood sugar spikes can also lead blood vessels to harden and narrow, increasing the risk of a heart attack or a stroke. Keeping all this in mind, I will continue to eat these types of sweets only occasionally.
B) My ideal Breakfast Food I love to explore different types of food and often eat a diverse diet across different ingredients and cuisines. Having said that, breakfast is where I tend to stick to a routine. I had a closer look at my breakfast habits as any optimisation here could make big improvements to my metabolic health.
My daily breakfast at home consists predominantly of two choices. Four to five times a week I eat yoghurt (Swedish Kvarg) with berries, cereal and sometimes supplemented with whey protein powder. Two or three times a week, I eat bread (mostly whole wheat sourdough) with cheese, ham and some raw vegetables. Given these two different breakfast choices, I was curious to find out which agreed better with my glucose/insulin system more.
The below chart shows the difference in glucose level after eating breakfast. The glucose level is normalised relative to its last value before starting the breakfast. The x-axis shows the time as relative time since the start of breakfast. You can see that both types of food caused a rise in glucose that peaks between 20–40 minutes after start.

Clearly, eating bread for breakfast causes my glucose to spike much more (peak of +1.5 mmol/L) — and slightly faster — than consuming the yoghurt (peak of +0.5 mmol/L). Furthermore, sugar levels at 100 minutes after the bread seem to be slightly below the baseline which could cause me to feel hungry again sooner.
Conclusions
Wearing the sensor for two weeks has been a highly informative experience. I hardly noticed the device after the first few hours, and retrieving the data through my phone worked mostly flawlessly. The data allowed me to confirm that my average glucose levels are well within the healthy range. This is further supported by another relevant measure reported by the FreeStyle Libre Link app: the HbA1c level. HbA1c (Hemoglobin A1c) reflects the average level of blood sugar over the past two to three months. Here again, my reported value is far below the critical value of 42 mmol/mol that would indicate pre-diabetes or other issues with my glucose-insulin dynamics.
Performing some simple data analysis taught me a lot about my body’s response to food, exercise and sleep in general. The data is very useful to drill into the effects of specific foods and meal-timing on one’s metabolism, although I concluded that two weeks was too short of a time window to really isolate the impact of certain foods.
I gained some good indications that yoghurt is a better breakfast choice for me than bread, but would need to perform more targeted experimentation to confirm this — the same goes for evaluating other food choices — where I would eat certain foods (ideally fasted) on multiple days and analyse the recorded glucose response. This would also require me to eat the food of interest in isolation and measure separately.
While it will of course take some time to analyze the different foods — such as pasta, rice, potatoes, fruits etc, given how easy this self-experiment was, I will definitely try again in future to make granular improvements to my nutrition.